

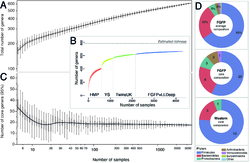
2 - Summary of gut microbiome composition in available western cohorts
Total number of genera comprising the human gut pan-microbiota increasing with (A) numbers of individuals or (B) inclusion of new cohorts included in chronological order. (C) Number of core genera (defined as present in >95% of sampled individuals) decreasing with total number of individuals. (D) Average abundances of FGFP core genera and their corresponding phyla (upper), number of core genera in each phylum for FGFP (middle) and for western population cohorts (lower). Solid lines in (A) and (C) correspond to smoothing spline fits (λ=3). All adult individuals from the following cohorts were included: HMP (14), YS (12), TwinsUK (13), and LLDeep (11).
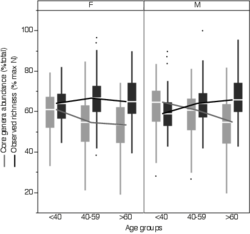
4 - Difference in richness and in core microbiota abundance according to age and gender in the FGFP.
The core microbiota is defined as the genera present in at least 99% of the samples of the FGFP. The core microbiota abundance decreases with age (Spearman correlation; Males: ρ=-0.29, p=6.4e-11; Females: ρ=-0.19, p=4.27e-6) and its richness increases with age (Spearman correlation; Males: ρ=0.27, p=6e-10; Females: ρ=0.08, p=0.037).
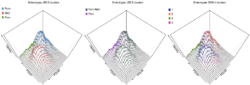
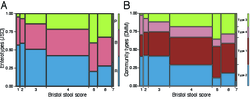
6 - Enterotypes distribution over BSS scores.
Enterotypes distribution over BSS scores showing an increase in Prevotella-enterotype (community type 3) individuals with looser stool consistency, and decrease in Ruminococcaceae-enterotype (community type 2). (A) Enterotyping performed according to the original approach of Arumugam et al. (18), with 3 clusters (JSD3). (B) Community types defined using the Dirichlet multinomial mixtures (DMM) approach from Holmes et al. (20)..
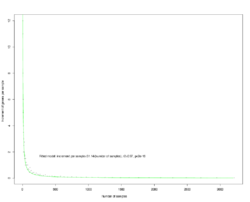
8 - Modeling the increment of observed genera with respect to number of samples.
Number of genera per sample was calculated from median number of observed genera after 500 times random sampling. The increment (number of new genera observed with more samples) can be modeled as a linear function of the inversed number of individuals. With the current estimation, 16,295 samples are needed to reach lowest estimate of full diversity (744 genera) and 94,178 for the highest estimate of full diversity (824 genera).
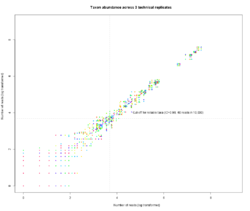
9 - Taxon abundances in technical replicates and cut-off for major genera.
Taxon abundances from three technical replicates of the same samples are plotted against each other (natural log transformed, rarefied at 10,000 reads per sample). When abundance was higher than 40 reads per replicate, the correspondence between replicates was larger than 98%.
| Name | Size | Description | Download |
|---|---|---|---|
| Supplementary_Table1 | 45K | Metadata variables collected for the individuals in the FGFP cohort. Name, number of missing values, category,distribution values for continuous variables (mean and standar deviation) and number of classes for categorical variables are provided. | Download |
| Supplementary_Table2 | 123K | Core microbiota composition. Distribution of genera in FGFP, LLDeep, UK twins, YS, and HMP. Core composition with core microbiota defined as genera present in 95 and 99% of samples, individual cohorts and cohort combinations, western and global. | Download |
| Supplementary_Table3 | 62K | Contributions of genera to community differentiation. Canonical correlation analysis (CCA) on raw and normalized genus abundances. Genus contribution (score) is calculated as the distance from the genus CCA coordinate to the CCA centroid. Larger values indicate higher contributions to community variation. | Download |
| Supplementary_Table4 | 12K | Summary of covariate redundancy analysis. When redundant covariates (correlations >0.8 or <-0.8) were identified, only the one with the highest correlation to microbiome variation was included in subsequent analyses. | Download |
| Supplementary_Table5 | 22K | Overview of the 69 covariates identified in the FGFP cohort. For each covariate, the effect size and significance are given (on FGFP cohort and stratified according to gender and age). in addition, as separate categories are 1/2 or 1/3 of original cohort size, we randomly sampled 1/2 or 1/3 of the cohort 100 times, and calculated the frequency (probability) of non-significant correlation for each covariate lower probabilities indicate robust correlations (e.g. stool score), while higher probabilities indicate less robustness and higher dependencies on sample size or lower power. | Download |
| Supplementary_Table6 | 55K | Summary of significant correlations between major genera/diversity and the 69 covariates. Major genera include 33 genera that have average abundance of >40 reads (see methods), and significant correlations are defined as FDR < 10%. | Download |
| Supplementary_Table7 | 26K | Summary of optimal generalized linear model for each major genus. Linear models are selected based on significantly correlated factors for each genus, and optimal linear models are selected via glmulti function (see methods). Explainable variations in each genus are given as linear model r2. | Download |
| Supplementary_Table8 | 52K | Summary of significantly interacting covariates. Interactions are tested using linear model for any two covariates that both correlate to certain genus, and those interaction with <10% FDR rate are defined as siginificant interactions; among the signficant interactions, those involving medications are shown in Figure 7. | Download |
| Supplementary_Table9 | 33K | Summary of combined effect size of covariate categories. Medication is separated from health information, for each category the maximum correlation to microbial variations (Bray-Curtis dissimilarity) and contributing covariate (identified by "bioenv" function, see methods) are given, as well as maximum correlation coefficient. A final combined effect size is provided for all categories combined. | Download |
| Supplementary_Table10 | 73K | Overview of the 18 non-redundant FGFP microbiome covariates as identified through stepwise RDA. Independent contributions to microbiome variation (R2). Genera correlating significantly (FDR<0,05) with non-redundant covariates. | Download |
| Supplementary_Table11 | 64K | Summary of MaAsLin analysis of microbiome variation in function of covariates. Genus-covariate correlations with FDR<0,2 are listed. Non-redundant covariates identified through RDA are identified. | Download |
| Supplementary_Table12 | 47K | Summary of microbiome variation in function of BSS score. Correlations of alfa-diversity measures, genera, and microbiome covariates with BSS are listed. Analysis of enterotype distribution over BSS scores. | Download |
| Supplementary_Table13 | 56K | Potential confounder identification in the FGFP for genera-disease associations reported in literature. (Tab1) List of genera-disease associations reported in literature and summary of potential confounders found. (Tab2) Details on confounder identification by correlations between genera abundances and FGFP microbiome covariates. | Download |
| Supplementary_Table14 | 12K | For each FABIA bicluster sample group, significantly altered metadata are listed. Significance is assessed with the hypergeometric distribution for binary and categorical data and the two-sided Wilcoxon rank test for numerical data. Metadata among the top factors identified with "envfit" are highlighted in bold. | Download |
| Supplementary_Table15 | 15K | Summary for matched case-control analyses for medication. (Tab1) Summary of the observed effects of medication on the microbial community from matched case-control analyses. (Tab2) Overview of the effect of amoxicillin usage on abundance of specific genera based on matched case-control analysis. | Download |
| Supplementary_Table16 | 51K | Power analyses using the FGFP data. (Tab1-2) Dirichlet Multinomial Models-based power analyses to determine minimum sampling size to observe microbiome shifts for the most abundant genera, and the most abundant OTUs, respectively. (Tab3) Obesity-targeted power analysis to compare the sampling size needed to observe obesity-associated shift in microbiome composition, withdifferent study designs and metadata recorded. | Download |
| Supplementary_Table17 | 39K | Overview of the different blood analyses. | Download |
Genus table (RDP classifier) and species-level OTUs (UPARSE, non-singletons) table of the FGFP project.